Fertilizer prices dramatically increased last Spring. After anhydrous ammonia spent most of 2018 around $500 per ton, prices jumped to more than $600 per ton in early 2019. Prices remained mostly unchanged until late summer. This week’s post reviews the latest fertilizer price data.
Lower Fertilizer Prices
Figure 1 shows the average prices of anhydrous ammonia, DAP, and potash in Illinois, as reported by the USDA, since January 2015. Fertilizer prices have fallen from their highs during the farm economy boom. Since 2015, anhydrous ammonia prices have ranged from a higher of more than $700 per ton to a low of $400 per ton.
Broadly speaking, prices reached their lows between 2016 and 2017. Potash prices fell to $300 per ton in late 2016, while DAP nearly hit $400 per ton in early 2017. Anhydrous ammonia hit its low of $400 per ton in late 2017. Since the 2016-2017 lows, prices have trended higher. Potash prices, for example, climbed from $300 per ton to nearly $400 per ton in 2019.
In recent weeks, fertilizer prices have sharply declined. Compared to prices last spring -the average of prices reported in April and May- anhydrous ammonia prices are down 22% and DAP 17% lower. Potash prices have also declined (-5%).
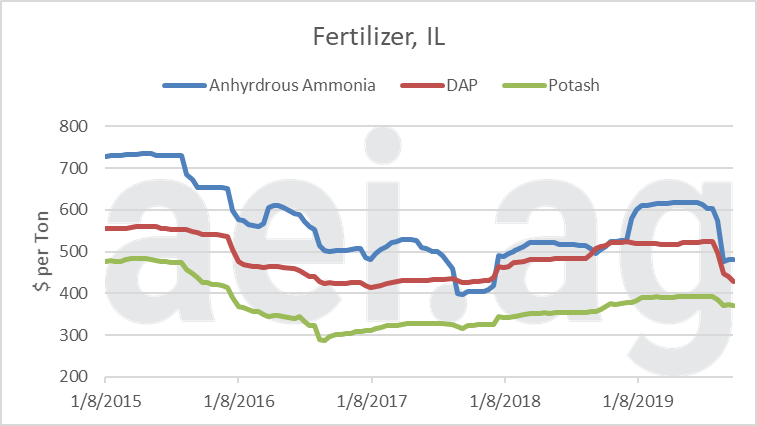
Figure 1. Select Fertilizer Prices, Anhydrous Ammonia, DAP, Potash. Jan. 2015 – Sept. 2019. Data Source: USDA AMS.
Nitrogen Prices
Of course, not all nitrogen prices are equal. Figure 2 shows the reported prices for anhydrous ammonia, urea, and liquid 28%. Over time, they have followed a similar price trend, and all three products have seen prices fall from spring highs. That said, anhydrous ammonia prices have fallen the most (-22%), while urea (-8%) and liquid 28% (-10%) have seen smaller adjustments.
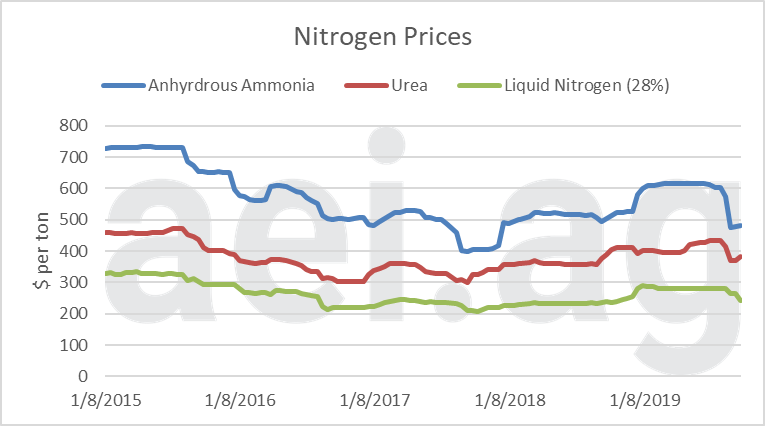
Figure 2. Select Nitrogen Fertilizer Prices, Anhydrous Ammonia, Urea, Liquid (28%). Jan. 2015 – Sept. 2019. Data Source: USDA AMS.
For producers with the ability to use alternative sources of nitrogen fertilizer, it is important to keep the relationship of nitrogen prices in mind. More specifically, the sharp price decline in anhydrous ammonia warrants a look at relative prices. Figure 3, which considers the price per pound of nitrogen applied, shows the prices of urea and liquid 28% relative to anhydrous ammonia.
Urea’s relative price (in blue) is an average of 1.22. In other words, a pound of nitrogen from urea costs, on average, 1.22 times a pound from anhydrous ammonia. In recent weeks, the price ratio reached an average of 1.39 in September, meaning urea prices are historically high relative to anhydrous ammonia. This result, not surprisingly, is due in part to the sharp anhydrous ammonia price decline.
The price relationship for liquid 28% (in red) has also jumped in recent weeks. In September, the price ratio was 1.54, above the long-run average of 1.36.
Two caveats are worth noting. First, the relative prices shown in Figure 3 only consider the price of the product. Other factors – such as application costs, timeliness, logistics, etc. – also impact producers’ decisions on which source to use.
Second, the price ratios can adjust in two ways: anhydrous price could increase, or urea and 28% prices could decline. While the ratio has moved in recent weeks by the large drop in anhydrous prices, it is never clear how the price ratio will adjust moving forward.
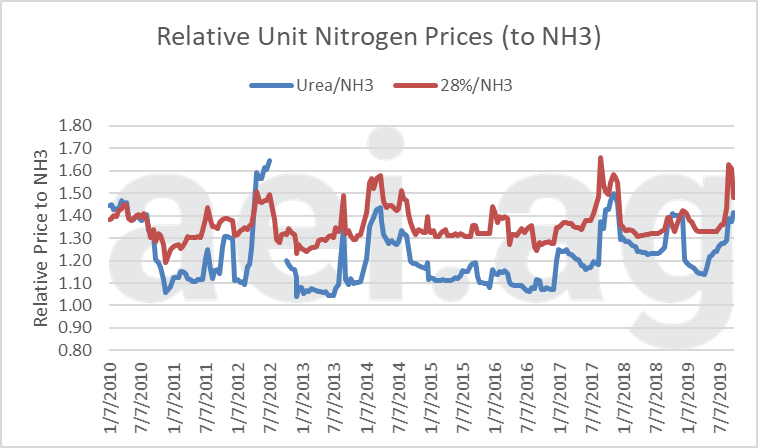
Figure 3. Relative Unit Nitrogen Prices, Urea/NH3, 28%/NH3. Jan. 2010 – Sept. 2019. Data Source: USDA AMS & aei.ag Calculations.
Fertilizer Expense
Another way of considering fertilizer prices is the expense associated with a 180-70-70 fertilizer rate. For this, we assumed the nitrogen source was anhydrous ammonia. Figure 4 shows the average spring expense of this fertilizer rate since 2010. Also included is the expense using the average prices in September 2019.
Figure 4 shows how significantly fertilizer prices have adjusted during the farm economy slow-down. Between 2011 and 2013, the example fertilizer rate had an expense of $160 per acre. By 2017, this fell to $101 per acre. In 2019, the spring price equated to an expense of $120 per acre – the highest since 2015 but well below 2011-2013 levels. Most recently, the average September prices were an expense of $99 per acre.
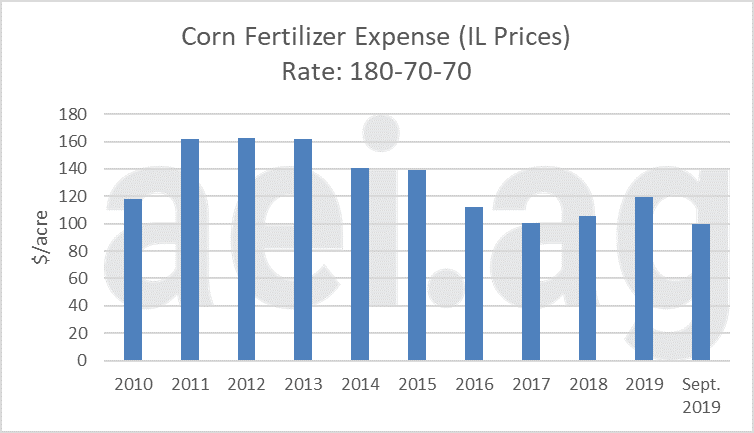
Figure 4. Annual Estimated Corn Fertilizer Expense (180-70-70), IL Spring Prices (Avg. of April – May) and Fall 2019. Data Source: USDA AMS and aei.ag Calculations.
Wrapping it Up
As producers planned to expand corn acreage in 2019, fertilizer prices soared to the highest levels since 2015. In recent weeks, however, prices have moderated as the expense of a 180-70-70 rate has fallen more than $20 per ace.
Producers should also consider the relative cost of various nitrogen sources. As a result of anhydrous ammonia prices falling sharply in recent weeks, urea and 28% prices are historically high relatively to anhydrous.
As 2020 comes into focus, fertilizer will likely be a great source of uncertainty and variability in crop budgets. Will fertilizer prices go higher, again, at the prospects of even larger 2020 corn acreage? Will anhydrous prices in Illinois again jump above an average of $600 per ton?
Source: Agricultural Economic Insights

